
The paired t-test is a fundamental statistical method designed to compare the means of two related groups. Whether you’re analyzing pre-test vs. post-test results, repeated measurements, or matched pairs, this test helps determine if the observed differences are statistically significant. Unlike independent t-tests, it accounts for natural variability within pairs, making it more precise for dependent data.
The paired t-test is particularly useful when working with dependent samples, where measurements are naturally linked. Common applications include:
Before-and-after studies (e.g., evaluating the effect of a training program).
Repeated measurements (e.g., blood pressure readings before and after treatment).
Matched experiments (e.g., comparing two treatments on the same subjects).
This test assumes that the differences between pairs follow a normal distribution, though it remains fairly robust with slight deviations. Since it focuses on within-pair changes rather than overall group differences, it often provides greater statistical power than independent-sample tests.
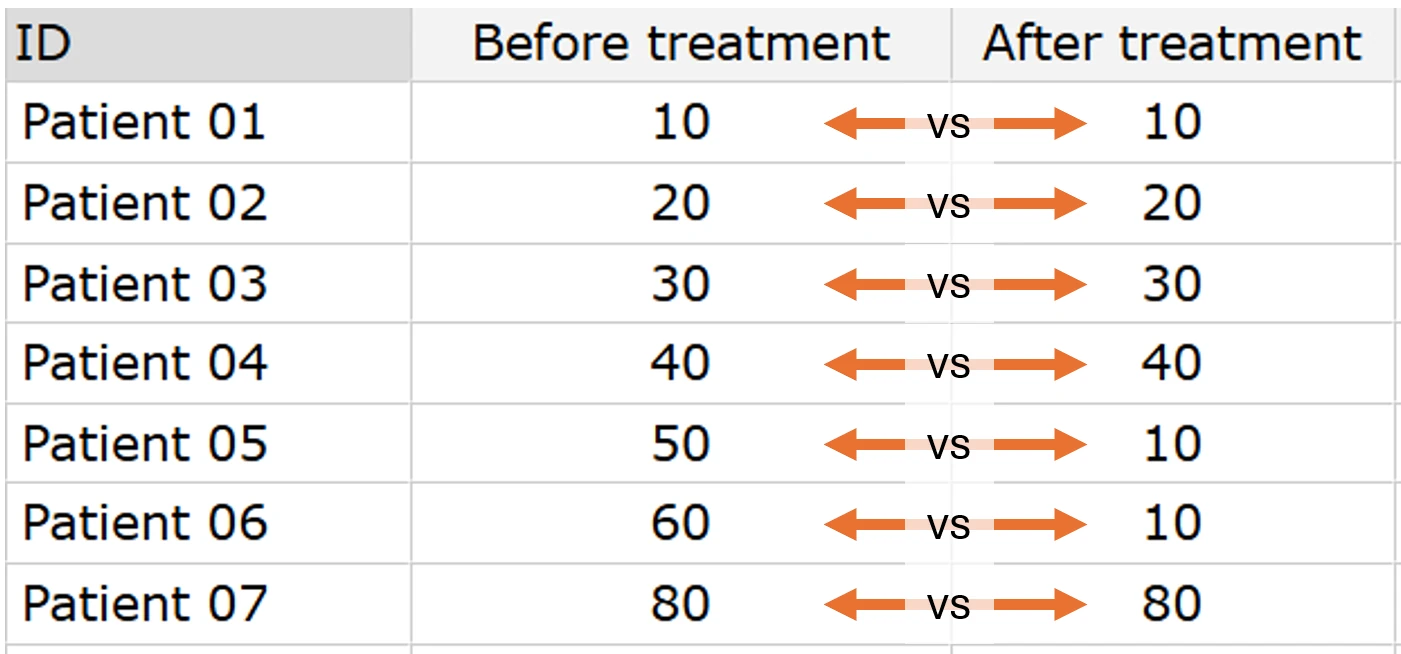
The figure above shows examples of two groups in a row with data suitable for analysis with a paired t-test. Note that the two groups, before and after treatment, are related to the same source, which is the same patient. If you believe your data is not following this pattern, check the Unpaired t test.
You should consider this test when:
The paired t-test returns two key numbers:

This is how you see the Paired t-test results with SimpliStats.
Obs: Note that SimpliStats will always return the raw p-value (column “p-value”) and to make your life easier, the p-value stratified by rounding (column “p-value rounded”) and by ns/*asterisk encoding (column “p-value *”)
Suppose a study measures patient pain levels before and after a new therapy:
Since 0.004 < 0.05, we conclude: “The therapy leads to a statistically significant reduction in pain.”
					from scipy.stats import ttest_rel

# Example: Test scores before and after a course
before = [65, 70, 80, 75, 90]
after = [72, 75, 85, 80, 95]

t_stat, p_value = ttest_rel(before, after, alternative="two-sided")
Input
Output
The paired t-test is an essential tool for analyzing dependent data, offering higher sensitivity than independent tests by reducing extraneous variability. It’s widely used in medical research, psychology, and business analytics to assess changes over time or between matched conditions.