
The Mann-Whitney U (also called Wilcoxon rank-sum test) test is a non-parametric statistical method used to compare differences between two independent groups. It evaluates whether one group tends to have higher or lower values than the other, without assuming a normal distribution. This test serves as the non-parametric alternative to the independent samples t-test and is ideal when working with ordinal data or non-normal continuous data.
Unlike the t-test which compares group means assuming normality, the Mann-Whitney U test works by comparing ranked values between the two groups. This makes it suitable for:
It is commonly used in clinical studies, biology data, behavioral research, or market comparisons involving two distinct groups (e.g., treatment vs. control, male vs. female, A vs. B).
The Mann-Whitney U test returns two key numbers:

This is how you see the Mann-Whitney U test results with SimpliStats
Note: A significant result tells you a difference exists, but not the direction. Use descriptive statistics to explore further.
Suppose we are comparing the age at diagnosis of :
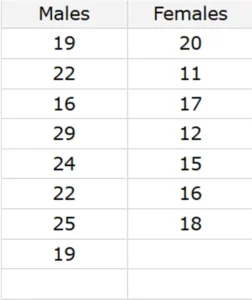
The data: Type II diabetes between males and females.
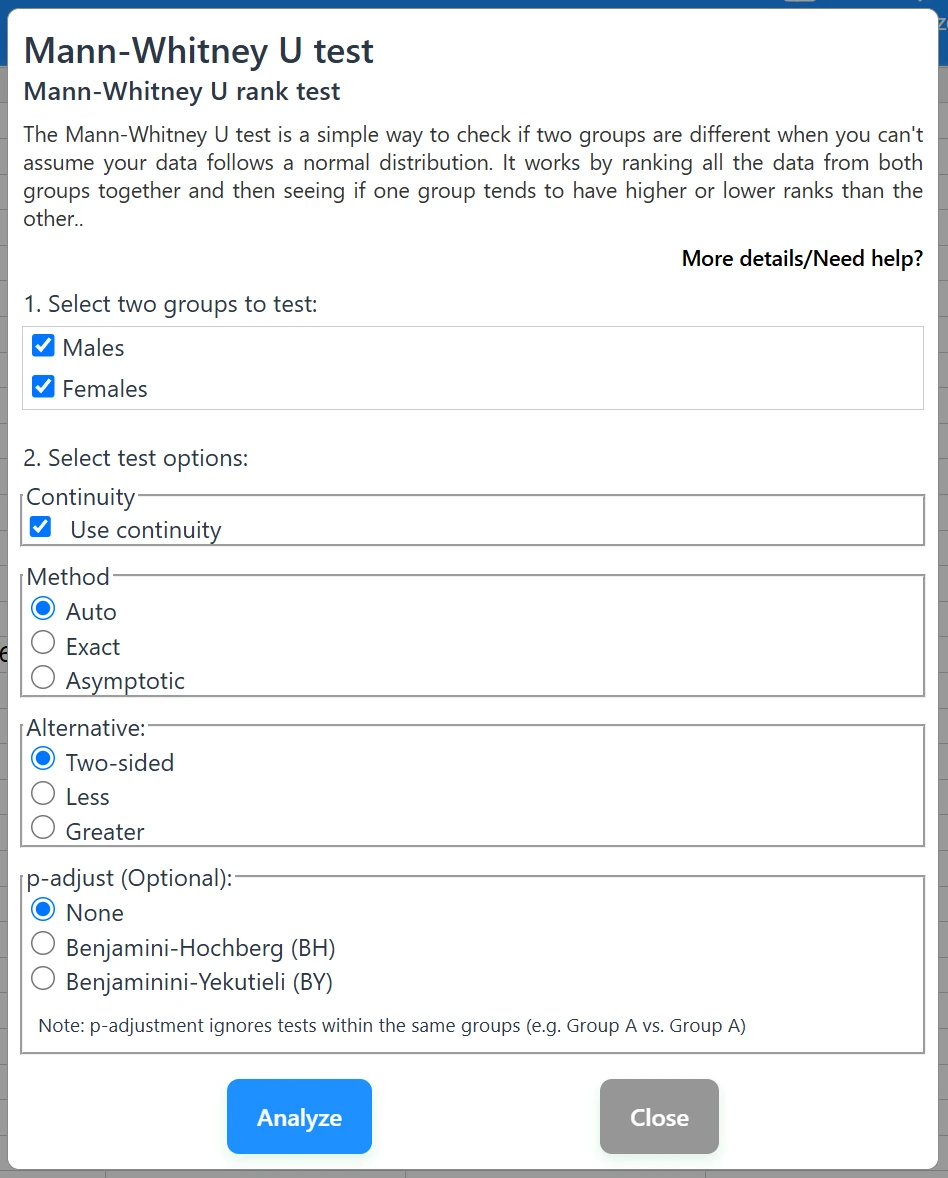
Mann-Whitney settings with SimpliStats: Select the groups, customize the options if needed, click in “Analyze”.
Results:
p-value: 0.010
Since p = 0.010 < 0.05, we conclude:
“There is a statistically significant difference in diagnosis age between males and females.”
When performing the Mann-Whitney U test, you can adjust how the p-value is computed depending on the sample size and the presence of ties between groups:
Use Continuity (Continuity Correction)
The continuity correction (adding 0.5) is applied when approximating the distribution of the test statistic using a normal distribution (asymptotic method).
This option is relevant only when method=’asymptotic’. The default is True in this case. It has no effect if other methods are used.
Method:
You can choose how the p-value is calculated using the method parameter:
					from scipy.stats import mannwhitneyu

statistic, pvalue = mannwhitneyu(x, y, method='auto', use_continuity = True, alternative='two-sided')
Input
Output
The Mann-Whitney U test is a robust and flexible non-parametric method for comparing two independent groups. It is especially useful when data doesn’t meet the assumptions of the t-test (e.g., normality, equal variance). Researchers across medical, social, and business fields use it to evaluate differences when working with ranks, medians, or skewed data.