
The unpaired t-test is a statistical method used to compare the means of two independent groups. This test determines whether there is a significant difference between the average values of two separate samples. Unlike paired tests, it does not assume any relationship between the groups, making it ideal for comparing distinct populations or experimental conditions.
The unpaired t-test is ideal for comparing two independent groups, like control vs treatment in clinical studies or different methods in ‘Group A’ vs ‘Group B’ testing. For reliable results, your data should be normally distributed, groups must be truly independent, and variables should be continuous. This makes it a powerful tool for detecting mean differences between distinct populations when used correctly.
Obs: For unequal variances check Welch’s t-test.
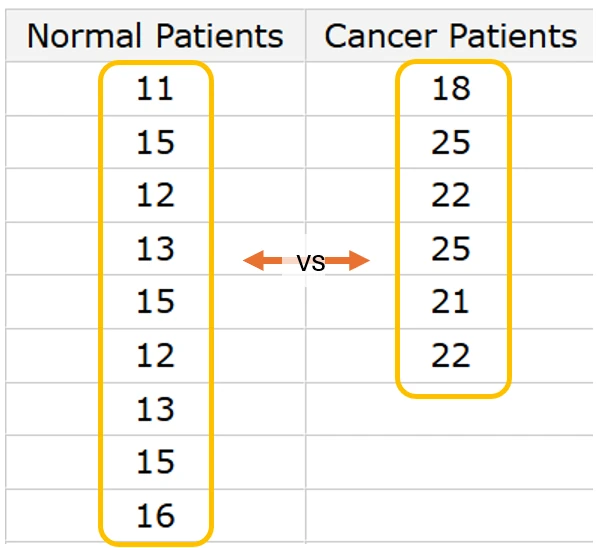
Figure: Example of how unpaired t test compare the sample groups. As groups are independent variables and are compared as a whole, they don’t need to have the same sample size.
The test provides:

This is how you see the Unpaired t-test results with SimpliStats.
Obs: Note that SimpliStats will always return the raw p-value (column “p-value”) and to make your life easier, the p-value stratified by rounding (column “p-value rounded”) and by ns/*asterisk encoding (column “p-value *”)
Suppose you compare exam scores from two different teaching methods:
Since 0.036 < 0.05, you conclude:
“There is a statistically significant difference in performance between the two methods.”
					from scipy.stats import ttest_ind

group_A = [78, 85, 92, 88, 76]
group_B = [72, 80, 85, 79, 74]

t_stat, p_value = ttest_ind(group_A, group_B, equal_var=True)
Input
True, assumes equal variances (standard Student’s t-test).Output
The unpaired t-test is a fundamental and versatile statistical tool for comparing means between independent groups, with applications spanning scientific research, business analytics, and data-driven decision-making. Its flexibility in handling both equal (Standard Unpaired Student’s t-test) and unequal variances (Welch’s t-test) makes it adaptable to real-world data scenarios. While robust for normally distributed continuous data, alternatives like the Mann-Whitney U test should be considered for non-parametric distributions. Proper application requires validation of assumptions—independence, normality, and continuous measurements—to ensure reliable conclusions about group differences.