Home • SimpleStats • User Guide and Documentation

☰ Menu
We are updating all the pages, it will be complete soon!

Analyze/Stats: Brunner-Munzel Test

The Brunner-Munzel test is a nonparametric statistical method used to compare two independent groups and determine whether one tends to yield larger values than the other. Unlike the Mann-Whitney U test, the Brunner-Munzel test does not assume equal variances or identical distribution shapes, making it more robust in situations where these assumptions may not hold.

Why Use This Test?

The Brunner-Munzel test is particularly useful when:

  • Comparing two independent samples that may have unequal variances.
  • The distributions of the two groups are not assumed to be the same.
  • Data are ordinal or not normally distributed.
  • A more robust alternative to the Mann-Whitney U test is desired.

This test assesses whether the probability that a randomly selected observation from one group exceeds a randomly selected observation from the other group is equal to 0.5.

When Should You Use the Brunner-Munzel Test?

  • You have two independent samples, possibly of different sizes.
  • The assumption of equal variances between groups is questionable.
  • You cannot assume that the distributions of the two groups are identical.
  • You are dealing with ordinal data or data that are not normally distributed.

Common Alternatives (When Brunner-Munzel Isn’t the Best Fit)

How to Interpret the Results

The Brunner-Munzel test provides two key outputs:

  • Statistic: Measures the difference between the two groups. Larger values indicate greater differences.
  • p-value: Indicates the probability of observing the data assuming the null hypothesis is true.

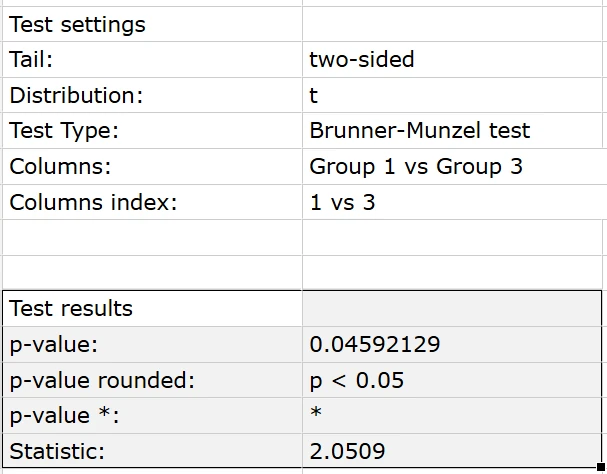
This is how you see the Brunner-Munzel results with SimpliStats

Decision Rule:
  • If p-value < 0.05 (or your chosen significance level): Reject the null hypothesis (there is evidence of a difference between the groups).
  • If p-value ≥ 0.05: Do not reject the null hypothesis (no statistically significant difference detected).
Example:

Suppose you compare two teaching methods (Group A vs. Group B) and obtain:

  • W Statistic = 3.14
  • p-value = 0.002

Since 0.002 < 0.05, you conclude: “There is statistical evidence that the two groups perform differently.

How the Function is Called

				
					import numpy as np
from scipy.stats import brunnermunzel

# Example data
x = np.array([...])  # Sample from group 1
y = np.array([...])  # Sample from group 2

# Perform the test
statistic, p_value = brunnermunzel(x, y, distribution='t')


Input

  • x and y: One-dimensional arrays containing the samples.
  • distribution: Specifies the method to calculate the p-value (‘t’ for t-distribution, ‘normal’ for standard normal distribution).

Output

  • statistic: The Brunner-Munzel W statistic.
  • p-value: The associated p-value.

Conclusion

The Brunner-Munzel test is a powerful nonparametric tool for comparing two independent samples, especially when the assumptions of equal variances or identical distributions are not met. Its robustness makes it a preferred choice in many practical situations, offering a more flexible alternative to traditional tests like the Mann-Whitney U.